The weather in Ondrejov is quite variable. Thus it is not easy to prepare something like a "calculator of a exposure time".
Generally, one can say that systematic decreasing temperature makes poor seeing while increasing temperature makes good seeing.
Typical seeing seems to be somewhere about 3arcsec. When the temperature is slowly systematically increasing, the seeing is much better. Opposite, if the temperature is decrasing, the seeing is poor and may even be about 6arcseconds.
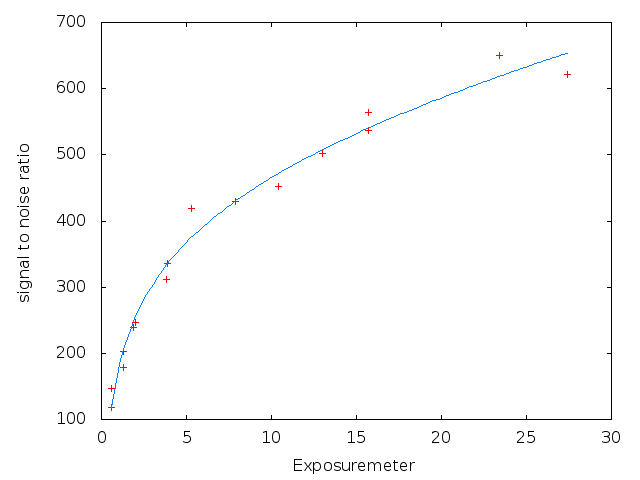
Thus we think it is appropriate to take into account better spectra with the same exposed signal (i.e. exposuremeter) than that with the same exposure time.
For you to get the picture about our abilities, we present a short table with measured signal to noise. We used measurement of the star eta UMa (Benetnasch, Alcaid, HD120315) which is one of our common test star.
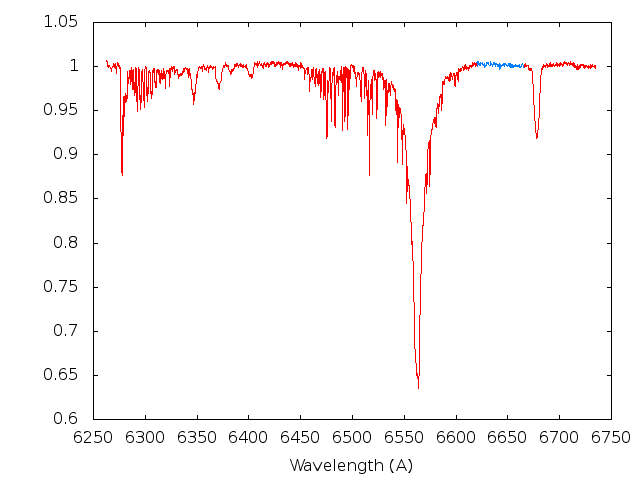
For the determination of s2n ratio we used spectra interval where no spectral lines are expected for this type of stars.
The s2n ratio was measured in the interval 6620-6665 angstroms.
See figure:
| Exp. time | Exposuremeter | S2N ratio |
|---|---|---|
| 10 | 0.6 | 146 |
| 20 | 1.3 | 202 |
| 30 | 2.0 | 247 |
| 60 | 3.9 | 335 |
| 80 | 5.3 | 419 |
| 120 | 7.9 | 429 |
| 160 | 10.4 | 452 |
| 200 | 13.0 | 502 |
| 240 | 15.7 | 536 |
| 360 | 23.4 | 650 |
| 420 | 27.4 | 621 |
| 240 | 15.7 | 563 |
| 60 | 3.8 | 311 |
| 30 | 1.9 | 239 |
| 20 | 1.3 | 177 |
| 10 | 0.6 | 118 |
One can find that the graph exposuremeter versus s2n ratio
is close-to-logarithmic:
The s2n ratio was measured in the interval 4780-4805 angstroms.
See figure:
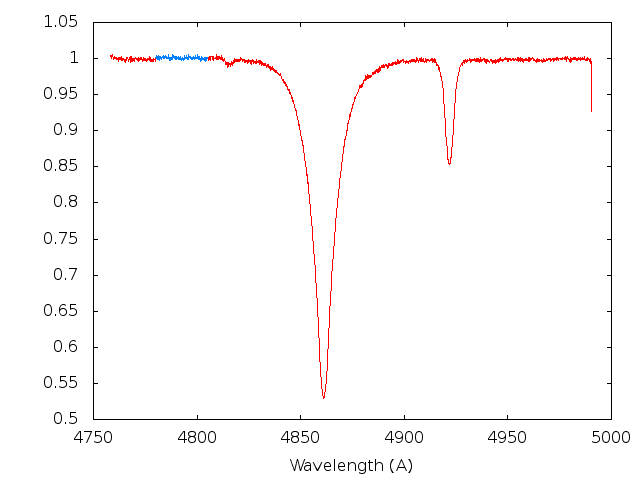
| Exp. time | Exposuremeter | S2N ratio |
|---|---|---|
| 120 | 7.5 | 201 |
| 240 | 15.4 | 333 |
| 480 | 31.1 | 433 |
| 960 | 61.6 | 481 |
| 3000 | 194.3 | 564 |
The s2n ratio was measured in the interval 4490-4505 angstroms.
See figure:
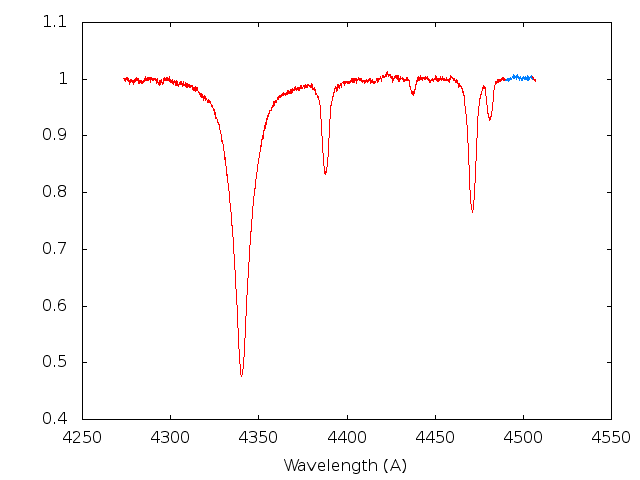
| Exp. time | Exposuremeter | S2N ratio |
|---|---|---|
| 120 | 7.7 | 195 |
| 120 | 7.6 | 186 |
| 240 | 15.5 | 240 |
| 240 | 15.6 | 308 |
| 960 | 62.4 | 407 |