Long-term photometric satellite experiments, such as CoRoT, Kepler, now TESS and the future PLATO, provide very rich material for studying the variability of various types of stars. Marek Skarka from the Stellar Department of ASU, together with colleagues from Czech and foreign institutions, focused on the photometric classification of medium-mass stars of spectral types A to F.
Abstract:
The goal of our study is to provide a reliable classification of variability of A-F stars brighter than 11 mag located in the northern TESS continuous viewing zone. We also aim at thorough discussion about issues in the classification related to the data characteristics and the issues arising from the similar light curve shape generated by different physical mechanisms. We used TESS long- and short-cadence photometric data and corresponding Fourier transform to classify the variability type of the stars. We present a clear and concise classification system that is demonstrated on many examples. We found clear signs of variability in 3025 of 5923 studied stars (51 %). For 1813 of these 3025 stars, we provide a classification. From the classified stars, 64.5 % are pulsating stars of GDOR and DSCT types and their hybrids. We realised that the long- and short-cadence PDCSAP data can differ significantly not only in amplitudes but also in the content of instrumental/data reduction artifacts making the long-cadence data less reliable. We identified a new group of stars showing stable light curves and characteristic frequency spectra pattern (8.5 % of the classified stars). According to the position in the Hertzsprung-Russell diagram, these stars are likely GDOR stars but are about 200 K cooler than GDORs on average and have smaller amplitudes and longer periods in average. We show that without spectroscopic observations, it can be impossible to unambiguously distinguish between ellipsoidal variability and rotational variability. We also apply our methodology to three previous studies and found significant discrepancies in the classification. We demonstrate how difficult the classification of variable A-F stars can be when using only photometric data.
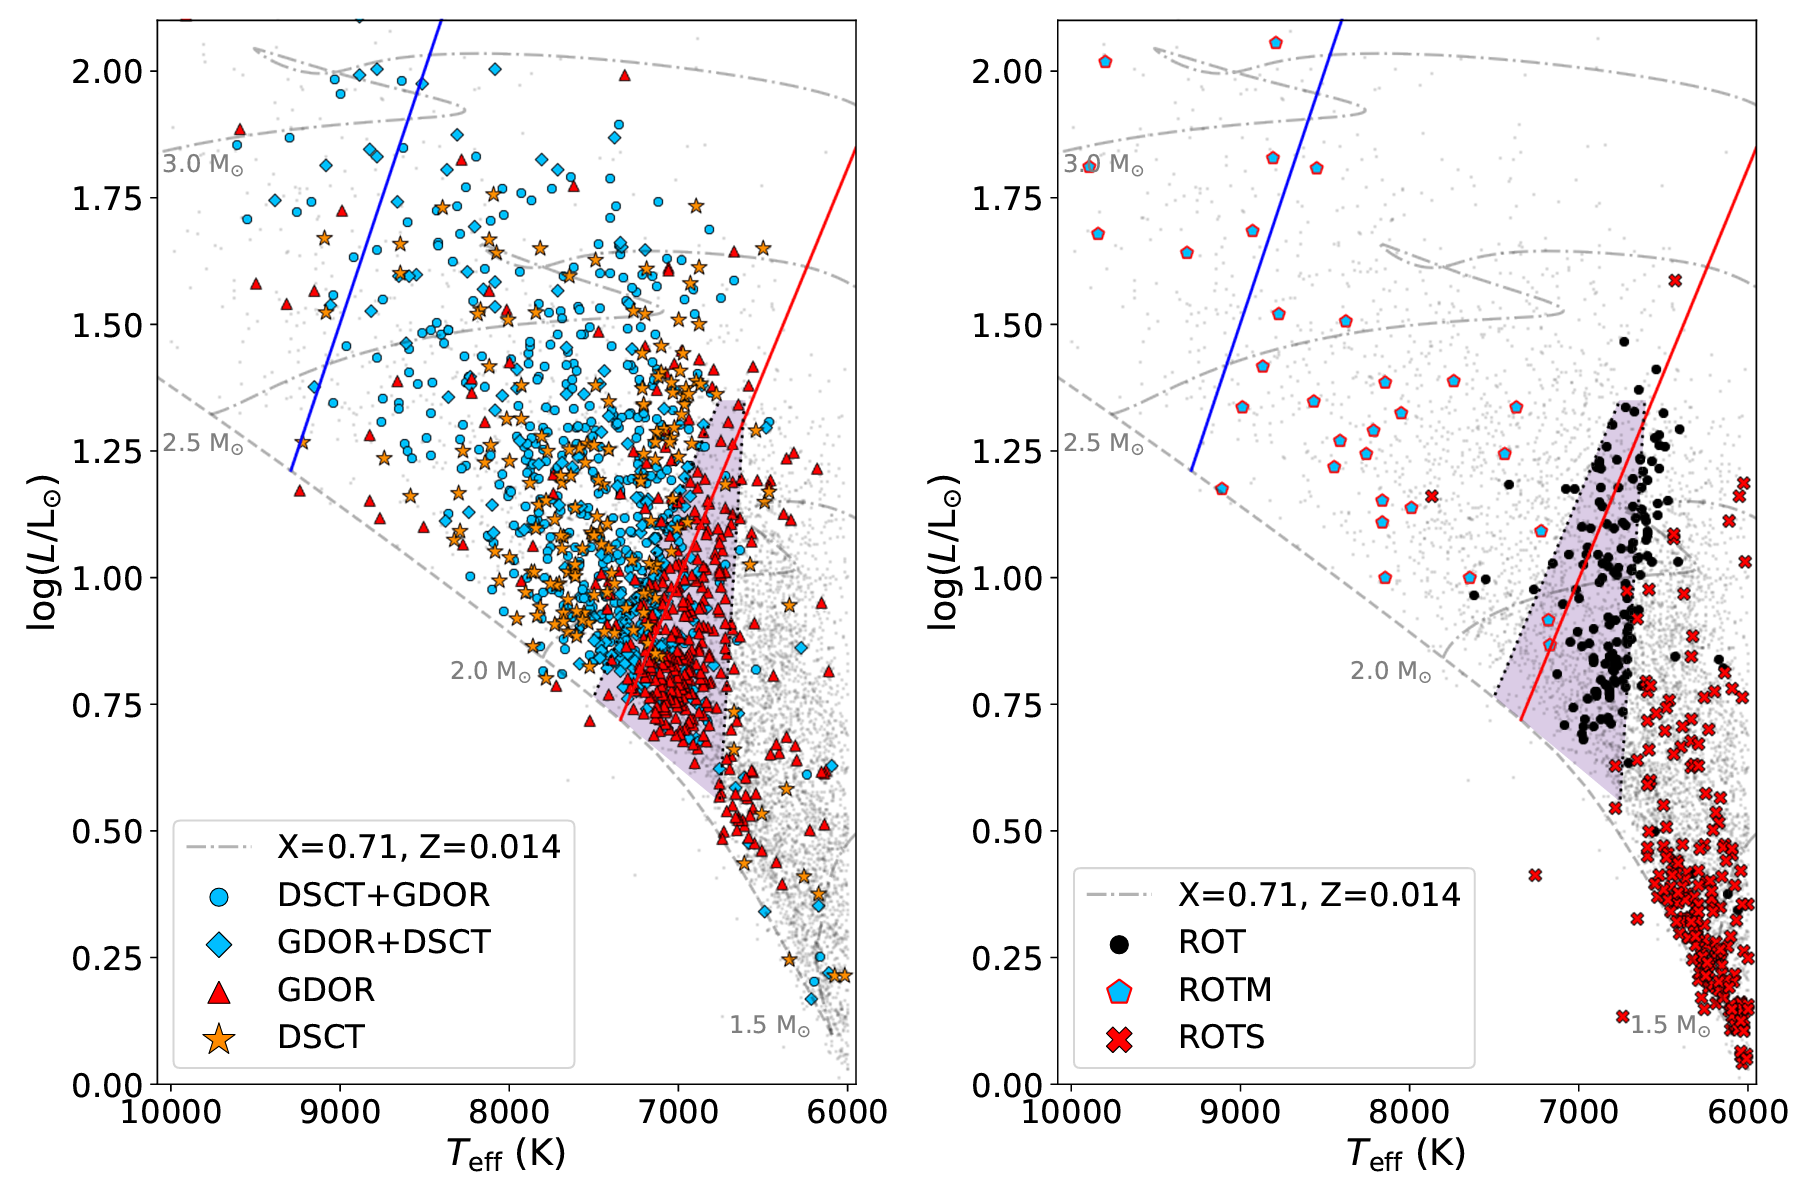
Image description: Hertzsprung-Russell diagram showing pulsating stars (left panel) and rotationally modulated stars (right-hand panel). The dashed line shows the zero-age main sequence, dash-dotted lines show the evolutionary tracks for stars with different masses, all taken from Murphy et al. (2019). The blue and red continuous lines show the empirical boundaries of the instability strip determined by Murphy et al. (2019). The shaded area enclosed by the dotted lines shows the GDOR instability region, following Dupret et al. (2005). The grey dots show all stars including non-variable stars in our sample
More informations:
- Press Release in Czech: Na čem pracujeme: Periodicky proměnné hvězdy středních hmotností dlouhodobě pozorované družicí TESS, AI CAS web page (M. Švanda)
- citace: M. Skarka, J. Žák a kol., Periodic variable A-F spectral type stars in the northern TESS continuous viewing zone, Astronomy & Astrophysics, preprint arXiv: 2207.12922
- Contakt: Mgr. Marek Skarka, Ph.D., marek.skarka@asu.cas.cz


