The IRAF has not very good manuals, so perhaps maybe useful to list some (very basic) tips and tricks.
Command flprc and we recommend, just to sure, repeat it once again.
The colon in the name of a directory is interpreted as a decimal number. I can avoid troubles writing the name into the quotation marks.
Example: I have to switch to the subdirectory 30:15, so I write
ecl>cd "30:15"
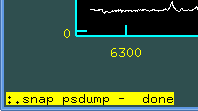
One must be in active graphical window. Then write down the command
:.snap psdump
:.snap epsfwill create *.eps file in the current directory.
Task implot
I have some raw (two-dimensional) spectra, want to overwrite them.
At first I depict one file by the standard way
implot a201407170037.fit
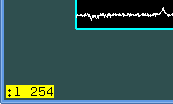
Then, in active graphical window, I write the command
:l 254
which will depict 254th line of the file (here it is the "crest" of the
stellar spectrum, it is a maximal value along the trace).
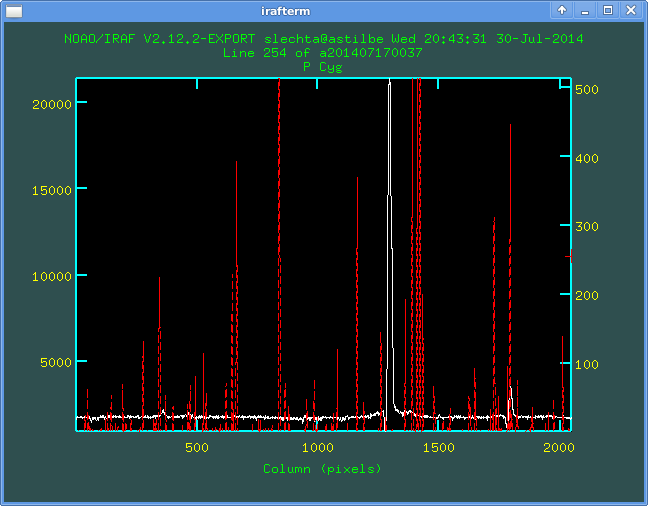
Having this, I write o (overplot), nothing happen but don't worry. Write :i (image) and name of the next file, for example a201407170006.fit which is a flat:
This example will plot the same line of the stellar spectrum and ThAr:
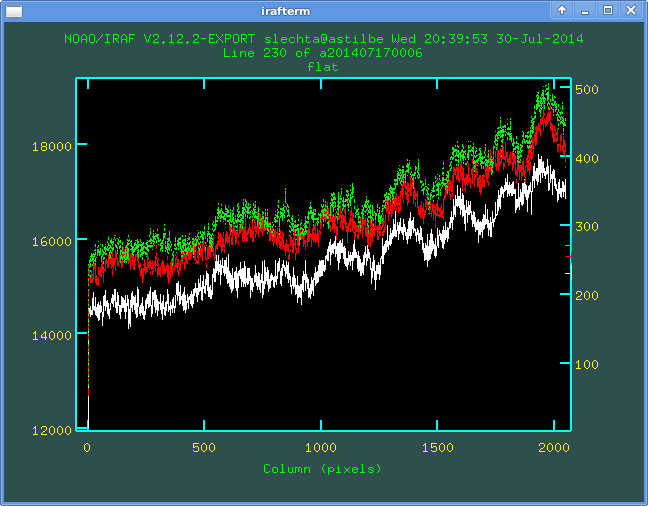
Of course, one can also overplot lines of the same spectrum. For example we overplot 230th, 254th and 270th lines of the flat field:
One can also plot and overplot columns, using command :c (column) instead of :l - the principle is the same.
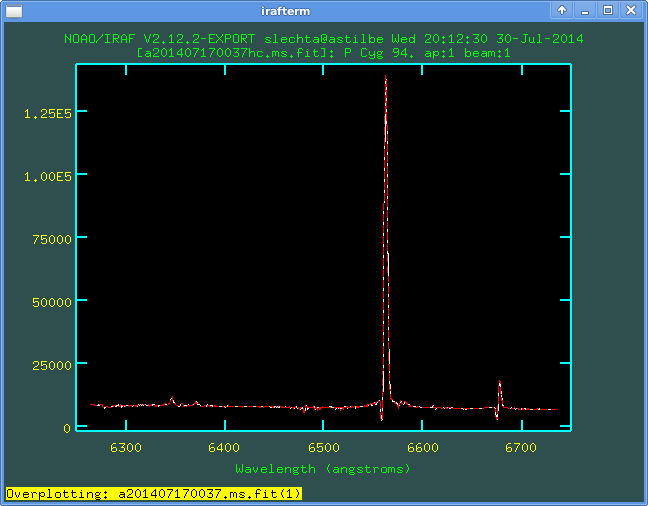
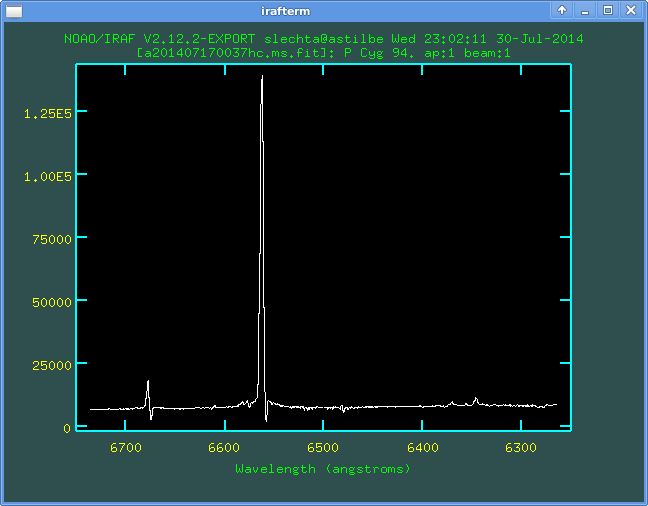
Task splot
I have two reduced (one-dimensional) spectra in the current directory,
want to overwrite them. At first I depict (by standard way) one spectrum
to the graphical window:
splot a201407170037hc.ms.fit
Then in this graphical window, I write o (nothing will happen but
don't worry) and g. This second character will activate
the command
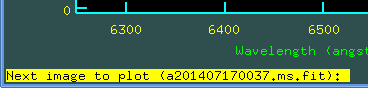
Next image to plot:
Write name of asked file (IRAF remembers the name from previous overwriting
and suggests it). Type the name and it will be overplotted:
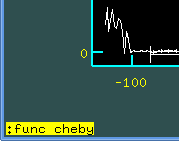
There are a lot of polynomials used in reduction process: background
correction, tracing the spectra, dispersion relation etc. One can change
the type or degree of polynomial. Let be in the active graphical window
and press command
:func cheby
will change the polynomial to Chebysheff's. By the same way one can change
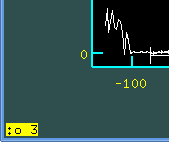
order of the polynomial by the command :o (order). For example
:o 3 will change the order to the second order, where
:o 1 is x**0 - first order (constant), :o 2 is
x**1 - second order (linear), :o 3 is x**2 - third order
(quadratic) etc.
Finally, there is necessary to press key f (fit) to run fit.
Let's have spectrum for normalisation. In the active graphical window we press key t will open a menu in the graphical window.
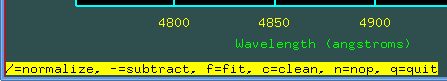
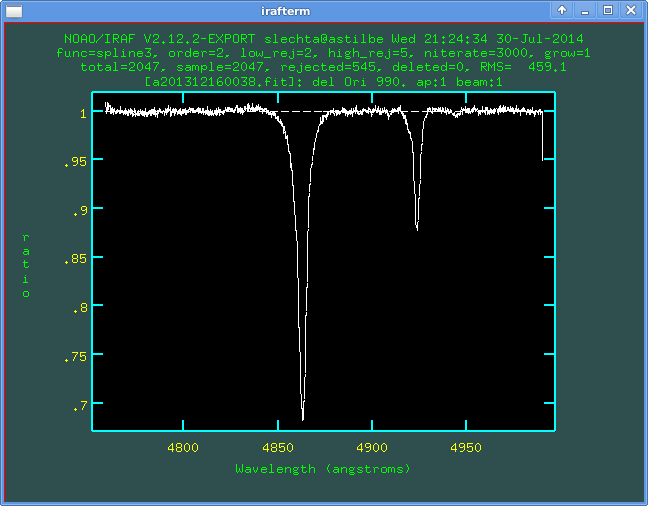
Here all data are taken into account. One can select regions for the normalisation - again using s at the beginning and also at the end of the region, can erase the region (z) etc.:
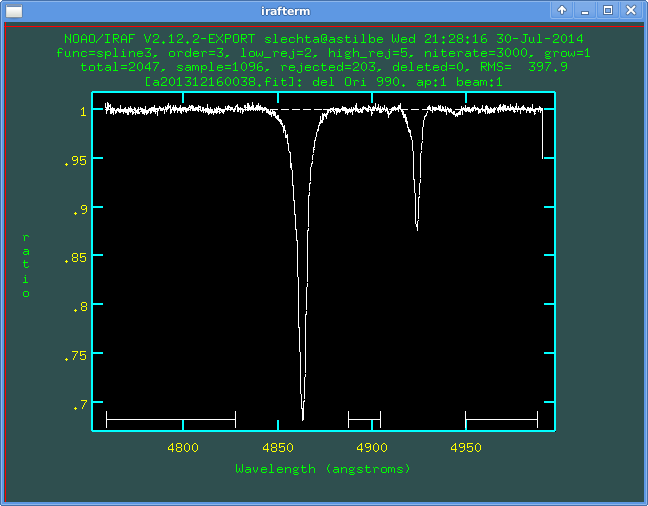
It is also possible to select rejection of improper points. It is via commands :lo 2 or :hi 2 - it is rejection of points over 2 sigmas to low (or high respectively) from the fit. After changing parameters one should press f to fit.
Now one can check types and orders of polynomials, erase and re-define regions, rejections etc. until is satisfied.
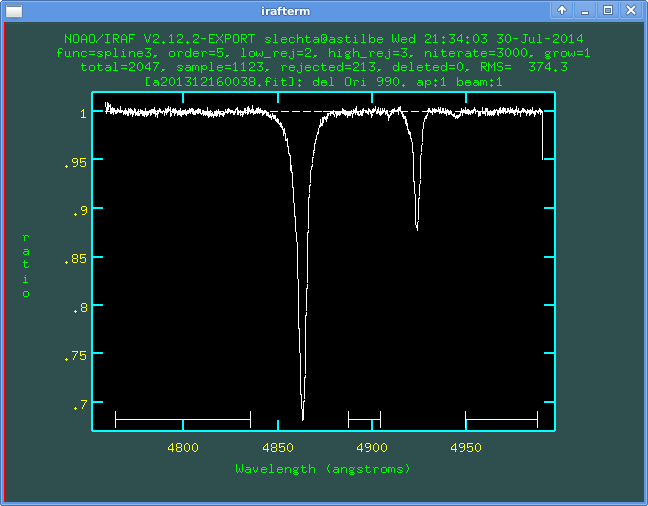
Now quit off this level q (the graphical window remains active):
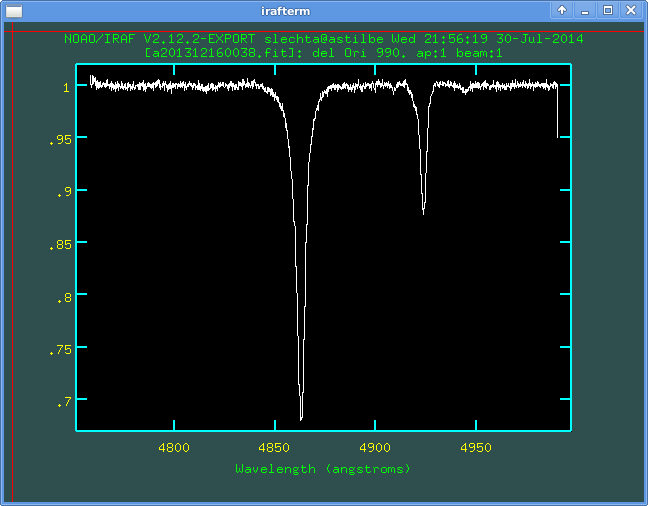
Press q and will return back to the command line (ecl).
One can depict the spectrum in the opposite direction (e.g. wavelength
increasing from right to left). In the active graphical window set
:/xflip yes and set r (replot):
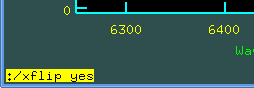
Return back is of course :/xflip no and r
Having reduced spectrum, we can depict in in splot also in pixels. The switching from angstroms to pixels and back is due to $ in the active graphical window.
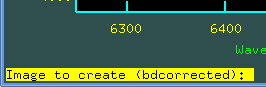
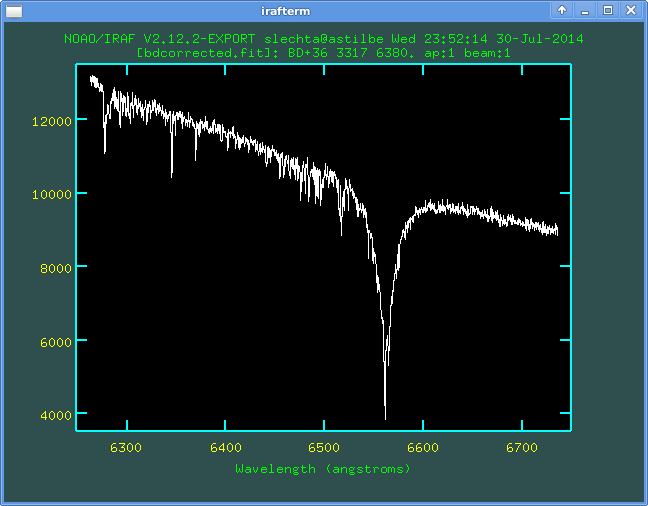
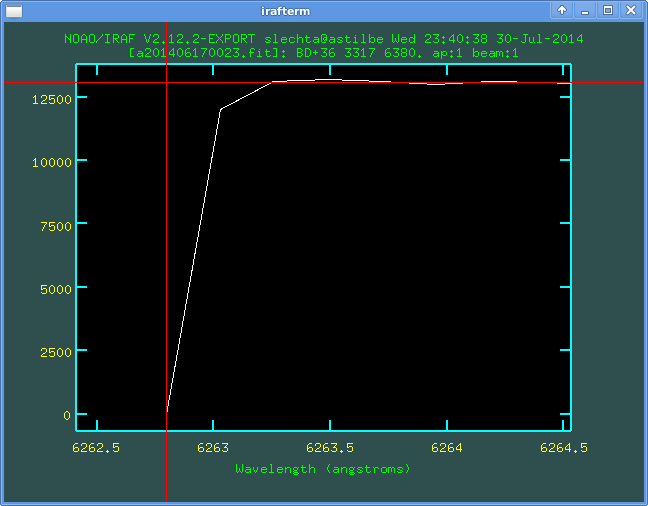
Maybe we have wrong pixel(s) in the reduced spectrum and need replace it (them) manually. For example on the spectrum a201406170023.fit of BD+36 3317 one can see the beginning of the spectrum is wrong.
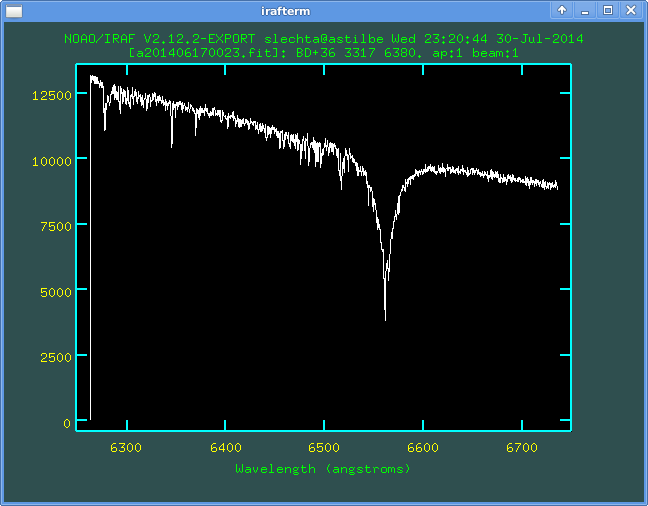
Let us plot the file via splot. In the active graphical window zoom some vicinity of the wrong pixel. We can see that first two pixels are wrong. Let us put the curson on the "correct" position onto which we will re-define the first wrong pixel:
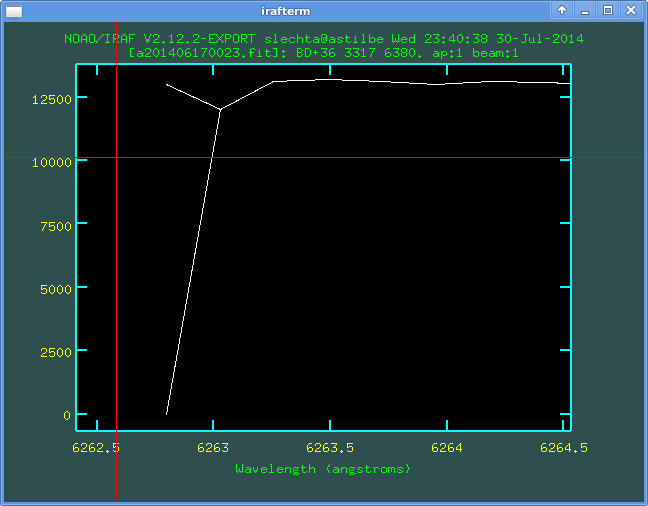
By the same way we find the second wrong pixel:
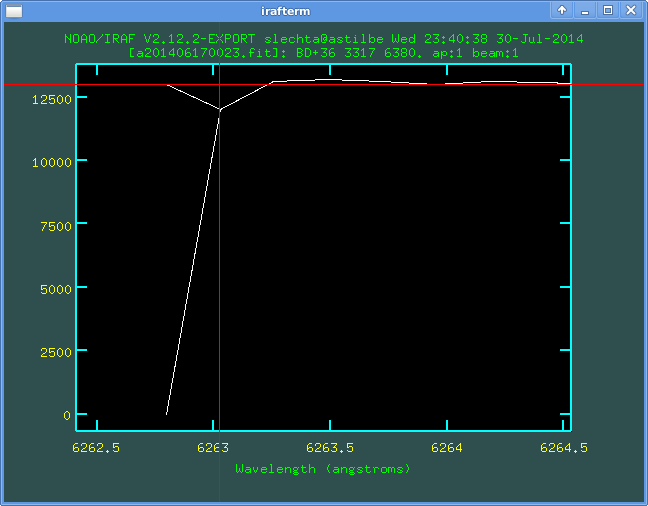
and also mark it via the key j.
All wrong pixels are replaced. Press i and save the new spectrum to the new file (do not press q before i or before selecting new name):