See also KPNO ThAr atlas
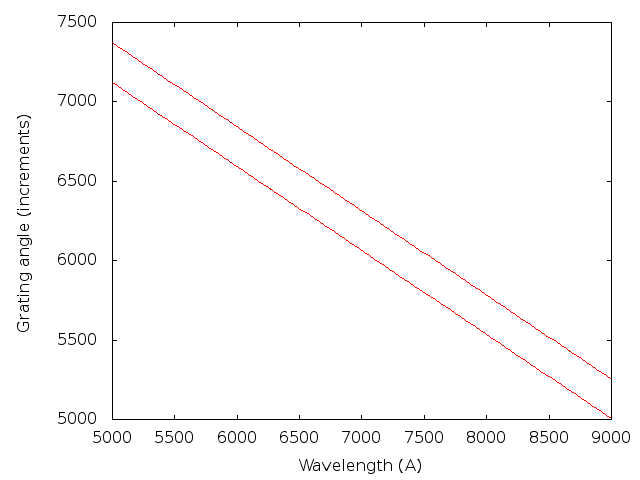
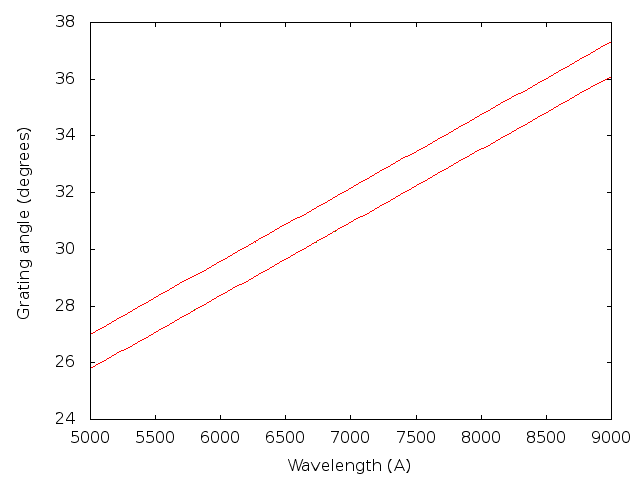
At first, we present tables and graphs depicting the beginnings and ends of exposed spectra as they depend on grating angle. Thus one can fit and find another angle of grating to depict asked spectral regions.
For the first spectral order (red regions)
| Grating angle | Spectral order | ||
|---|---|---|---|
| Increments | Degrees | Beginning | End |
| 5321 | 35.78 | 8401.4 | 8869.9 |
| 5430 | 35.25 | 8197.2 | 8666.3 |
| 6382 | 30.62 | 6406.2 | 6878.6 |
| 6457 | 30.25 | 6263.5 | 6736.0 |
| 6943 | 27.88 | 5328.6 | 5801.4 |


and for the second spectral order (blue regions)
| Grating angle | Spectral order | ||
|---|---|---|---|
| Increments | Degrees | Beginning | End |
| 4712 | 38.75 | 4758.8 | 4991.1 |
| 5040 | 37.15 | 4459.9 | 4693.4 |
| 5242 | 36.17 | 4273.7 | 4507.7 |
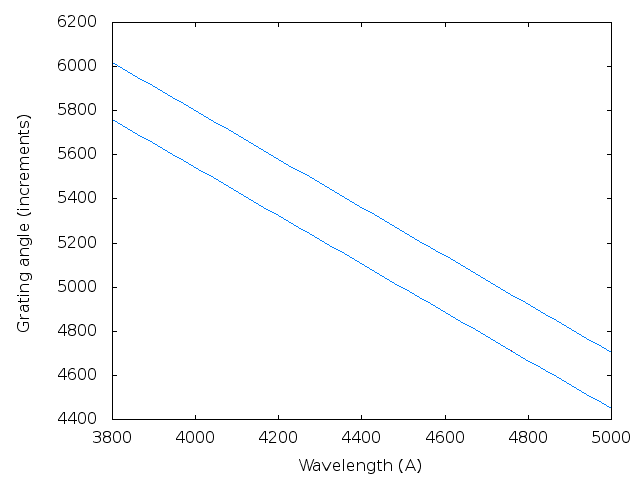
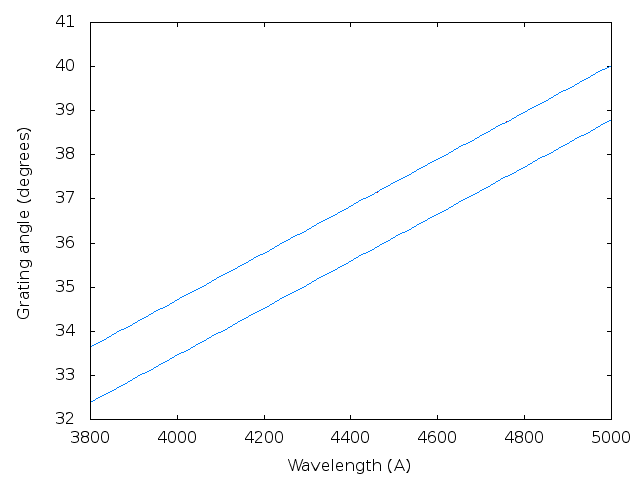
One can see that grating angles in increments are in "anticorrelation" with the degrees (when increments are increasing, degrees are decreasing).
Gaia region
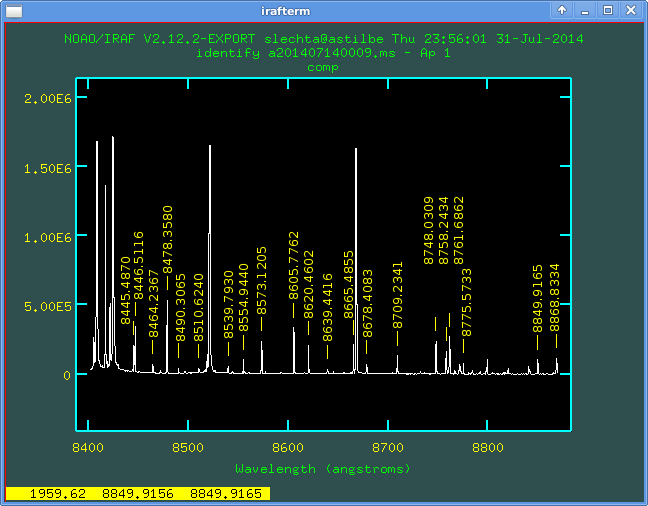
O I region
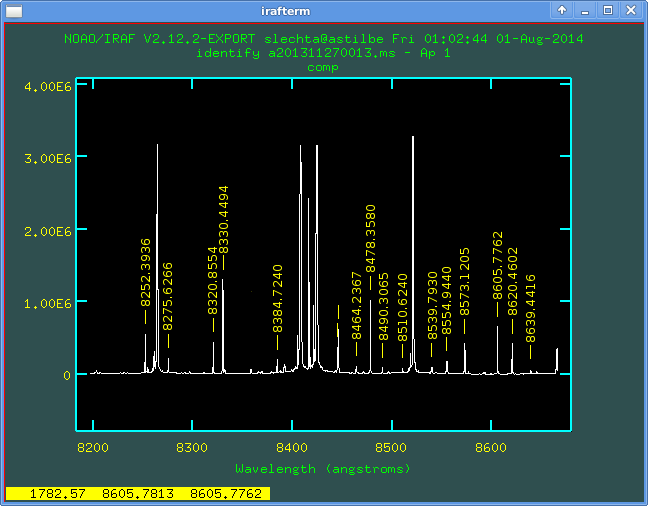
He I region
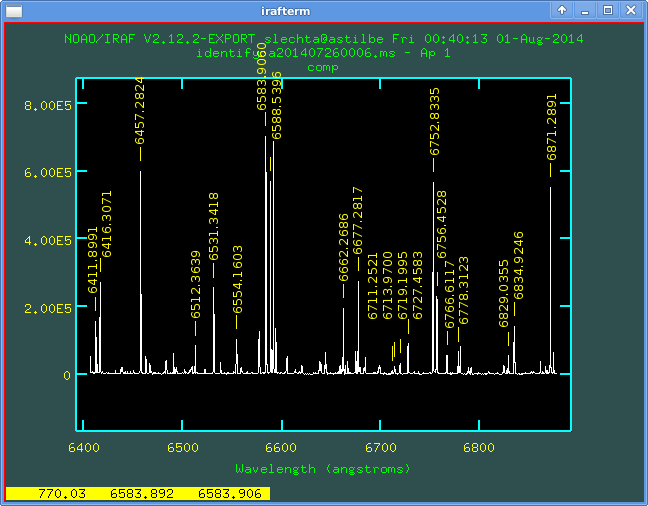
H alpha region
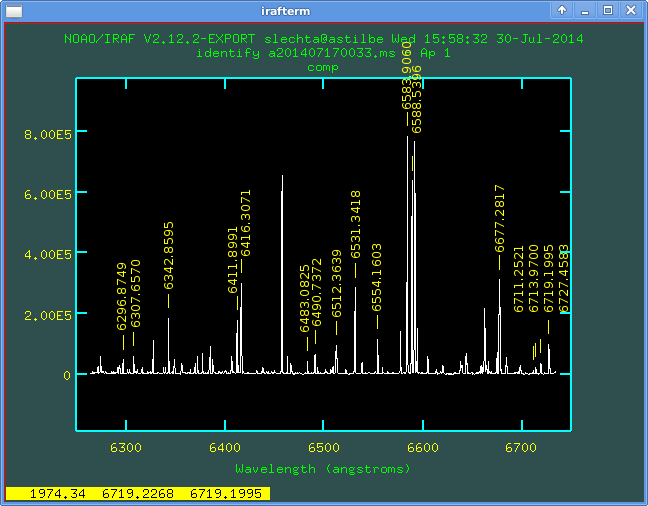
N II region

H beta region
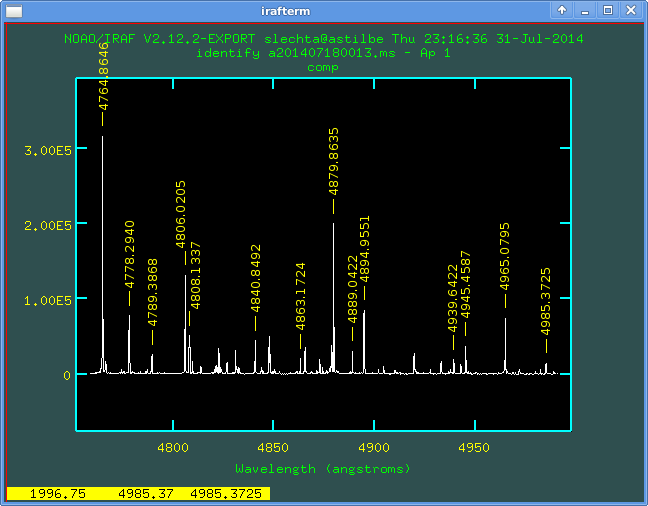
H gamma region
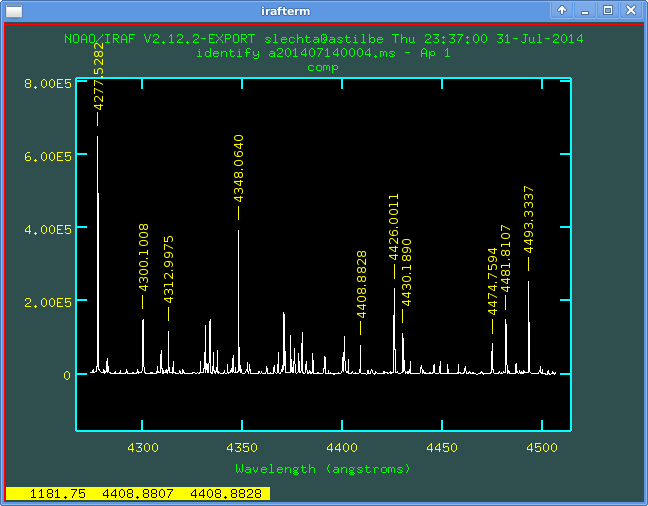
Fe II region
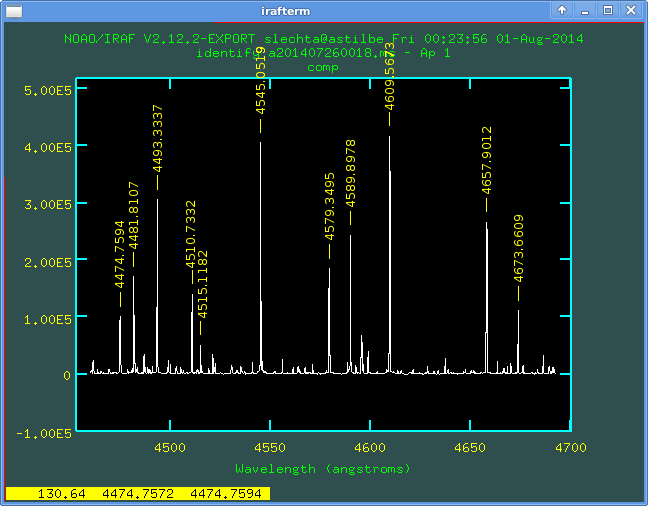
Mg II region
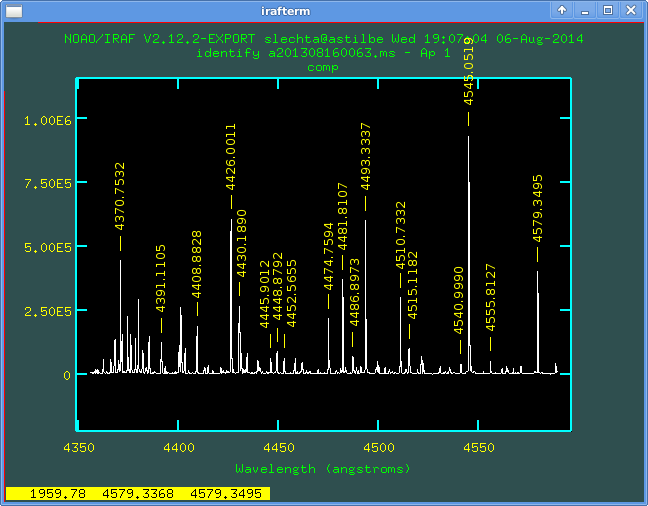
Region of high Balmer lines
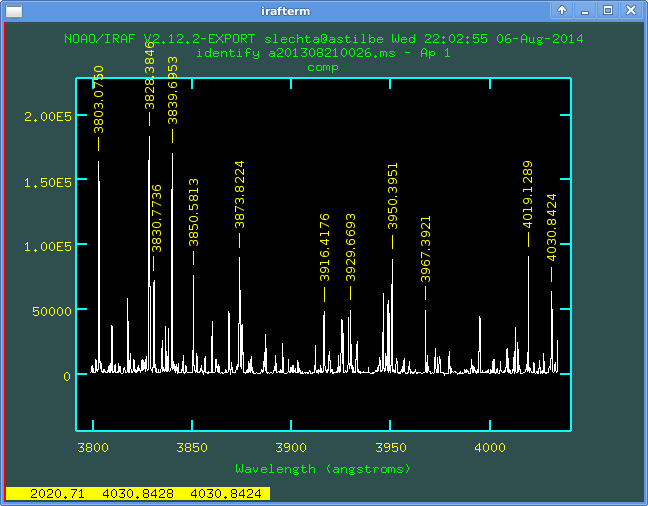
We do not recommend to observe under 3800A (i.e. under the last presented
region) because the efficiency of the CCD chip is falling down steeply
around these wavelengths.
PREVIOUS
UP
NEXT