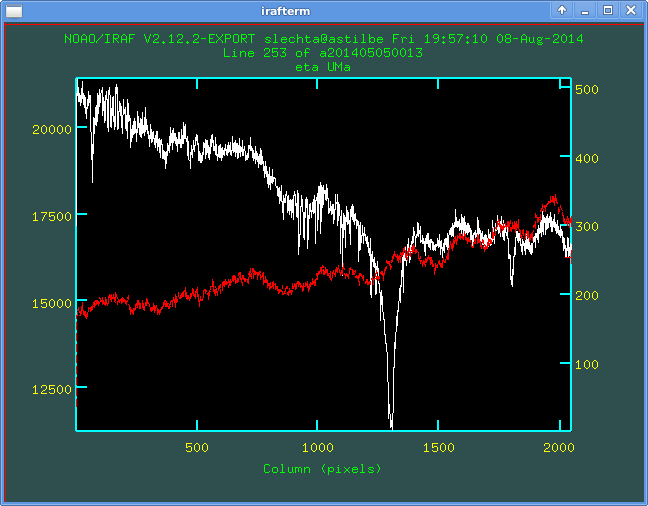
Comparison of raw continuum of star (white) and flat (red). Depicted 253th line on the chip, where the maximal signal (cross section of the spectra is like-gaussian) of the star is depicted.
During the (clear) night se secure four types spectra: zero, flat, comp (ThAr) and objects. We do not secure darks.
We tested an influence of darks on stellar spectra but it is found to be negligible. The level of "zero signal" is indistinguishable from zero files and also the rms is negligible in comparison to zero.
The mean value of zero file is 600.2ADU, its rms is 3.6 (one should exclude potential cosmics. Remind that cosmic may rarely penetrate also to the zero despite zero exposure time of the file0.
Having 3600s dark, the mean value is 600.3 and rms is about 3.8 (cosmics were eliminated systematically).
Remark: One can find the exposure times of zeros do not correspond to expected 0s. The operating software does not enable the premature reading out the CCD chip - when one set exposure time, it is not possible to readout the chip (clouds etc.). However the device enables to control via TTL. So we had to connect an additional electronic element for such additional control. The caused delay is 1-2s for zero and 1s for other files.
The continua of raw spectra are distorted. This seemingly trouble
is, in fact, no problem, the flatfielding eliminate the distortion.
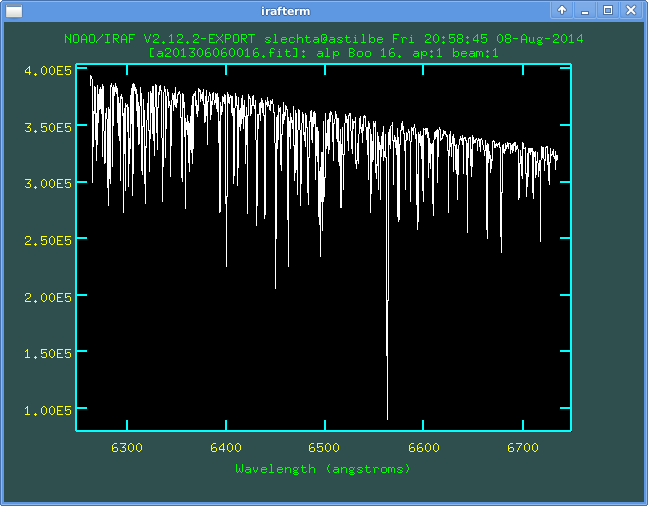
As an example we put reduction of eta UMa:
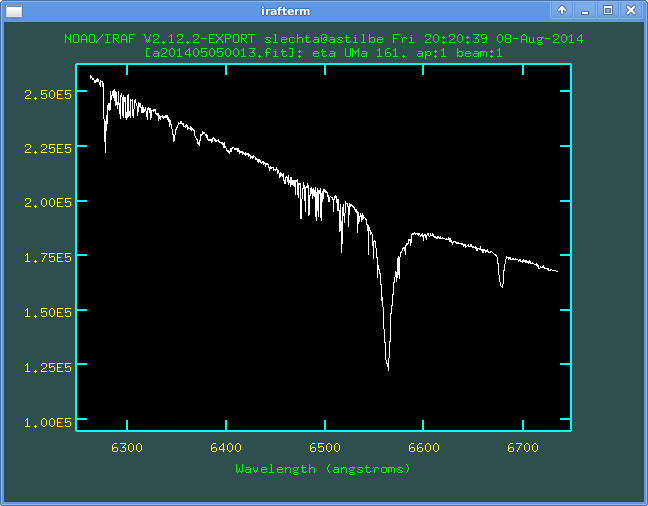
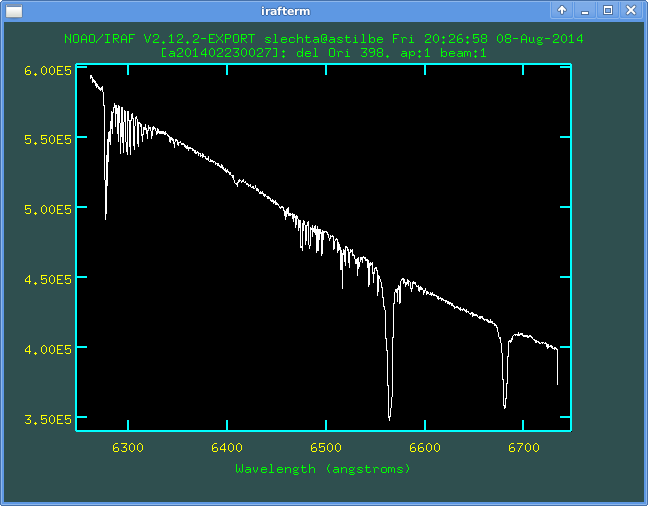
The seeming "break point" in continuum in Halpha is real effect on
eta UMa spectrum. For comparison, see spectrum of delta Orionis or
alpha Bootis:
The optical system has variable sensitivity in different wavelenghts. One also should take into account we observe in two spectral orders (first and second) so we have different resolution. As a result, the exposure times are very different. Generally, in the red region (i.e. first spectral order) are much shorter than in the blue region (i.e. second spectral order):
First order (red region)
| Spectral region (or line) | Central
wavelength (A) | Exposure time (s) | |
|---|---|---|---|
| Flat | ThAr | ||
| infra | 8719 | 15 | 100 |
| gaia | 8637 | 15 | 100 |
| O I R | 8434 | 15 | 100 |
| P jump | 8325 | 15 | 90 |
| Ca II | 7234 | 10 | 70 |
| He I 7065 | 7046 | 10 | 70 |
| H alpha | 6500 | 10 | 70 |
| Na dublet | 5875 | 10 | 50 |
Second spectral order (blue region)
| Spectral region (or line) | Central
wavelength (A) | Exposure time (s) | |
|---|---|---|---|
| Flat | ThAr | ||
| H beta | 4875 | 100 | 100 |
| He II 4686 | 4680 | 200 | 180 |
| Mg II | 4500 | 250 | 250 |
| H gamma | 4390 | 250 | 250 |
| H delta | 4092 | 300 | 300 |
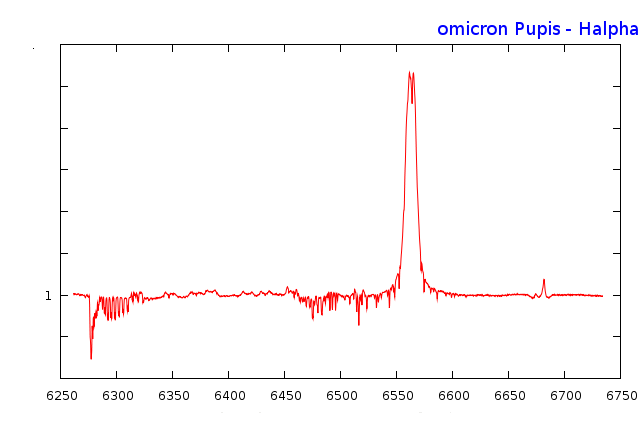
As one can see, we very often secure asked spectra line out the center of
depicted area. We want to have continuum on each edge of the depicted
spectra. As an example we picture spectrum of omicron Pupis in Halpha region
One can see that we have about 14 angstroms of continuum on "blue" edge
of the spectra (6262 - 6274A) and then there is a group of telluric
lines: